Zoho Analytics Explained: Turn Business Data Into Better Decisions
ZOHO ANALYTICSDASHBOARDS4 MIN READ
A simple guide for businesses that have outgrown their spreadsheets.
Why do spreadsheets become difficult as a business grows?
Spreadsheets are useful for simple lists and quick tracking. But when a business grows, managing sales, production and other information across many files can become confusing.
Sales data may sit in one spreadsheet while production data sits in another. Manual entry leads to typing mistakes, broken formulas and outdated reports.
The version problem. When reports are shared by email, it is hard to know which one is the latest. Most teams recognise the moment they are looking at three files named final, final2 and final_updated.
The same information, before and after: separate files with separate versions, or one place everyone reads from.
What is Zoho Analytics?
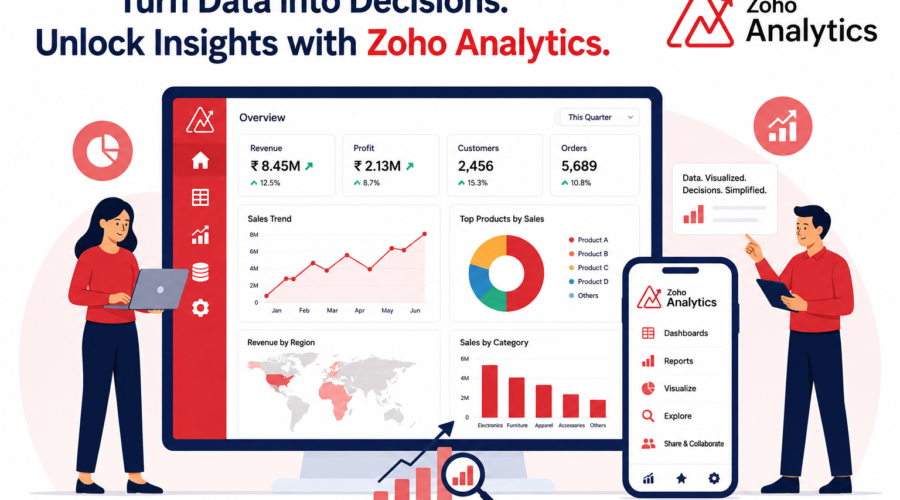
Zoho Analytics is a business analytics and dashboard platform. It brings business data together and turns it into visual reports that are easy to read.
How can Zoho Analytics help?
What it does
What that means day to day
Real-time visibility
You see important changes sooner — a slowdown in production, or a rise in sales in one region
Connects sales and production
You can see how a change in sales orders affects production capacity and planning
Questions in plain language
Ask “what is our top-selling product this quarter?” and turn the answer into a chart
Less manual work
Monthly reports update themselves instead of being rebuilt by copy and paste
From guesswork to better decisions
When business information sits in clear dashboards, teams spend less time preparing spreadsheets and more time understanding what the numbers mean.
Where to start. Pick the report your team rebuilds most often by hand. If it takes half a day every month, automate that one first.
Not sure which setup fits your business? ITOTCloud Systems is a Zoho Premium Partner working with businesses across Pune and India.